6c1e6d7395d1756c3f6976ad7a2e45c66220abbb
EmbeddingBuddy
A Python Dash application for interactive exploration and visualization of embedding vectors through dimensionality reduction techniques.
Overview
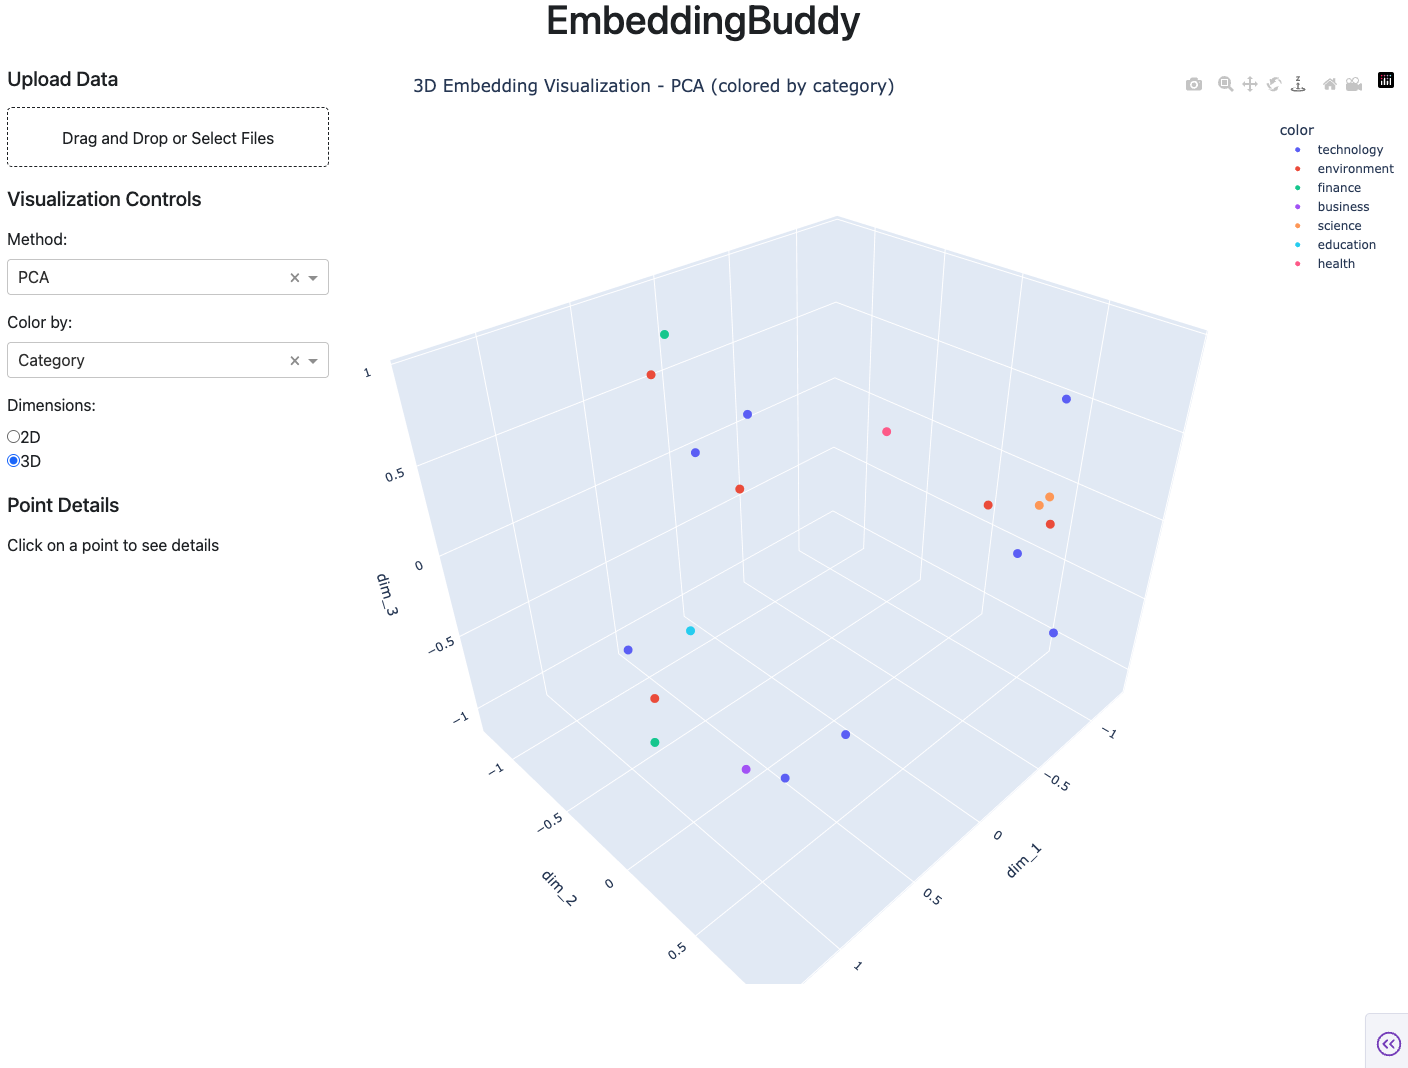
EmbeddingBuddy provides an intuitive web interface for analyzing high-dimensional embedding vectors by applying various dimensionality reduction algorithms and visualizing the results in interactive 2D and 3D plots.
Features
- Dimensionality Reduction: Support for PCA, t-SNE, and UMAP algorithms
- Interactive Visualizations: 2D and 3D plots using Plotly
- Web Interface: Built with Python Dash for easy accessibility
- Vector Analysis: Tools for exploring embedding vector relationships and patterns
Data Format
EmbeddingBuddy accepts newline-delimited JSON (NDJSON) files where each line contains an embedding document with the following structure:
{"id": "doc_001", "embedding": [0.1, -0.3, 0.7, ...], "text": "Sample text content", "category": "news", "subcategory": "politics", "tags": ["election", "politics"]}
{"id": "doc_002", "embedding": [0.2, -0.1, 0.9, ...], "text": "Another example", "category": "review", "subcategory": "product", "tags": ["tech", "gadget"]}
Required Fields:
embedding: Array of floating-point numbers representing the vectortext: String content associated with the embedding
Optional Fields:
id: Unique identifier (auto-generated if missing)category: Primary classificationsubcategory: Secondary classificationtags: Array of string tags for flexible labeling
Features
- Drag-and-drop file upload for NDJSON embedding datasets
- Multiple dimensionality reduction methods: PCA, t-SNE, and UMAP
- Interactive 2D/3D visualizations with toggle between views
- Color coding options by category, subcategory, or tags
- Point inspection - click points to view full document content
- Sidebar layout with controls on left, large visualization area on right
- Real-time visualization optimized for small to medium datasets
Installation & Usage
This project uses uv for dependency management.
- Install dependencies:
uv sync
- Run the application:
uv run python app.py
-
Open your browser to http://127.0.0.1:8050
-
Test with sample data by dragging and dropping the included
sample_data.ndjsonfile
Tech Stack
- Python Dash: Web application framework
- Plotly: Interactive plotting and visualization
- scikit-learn: PCA implementation
- UMAP-learn: UMAP dimensionality reduction
- openTSNE: Fast t-SNE implementation
- NumPy/Pandas: Data manipulation and analysis
- uv: Modern Python package and project manager
Description
v0.5.0
Latest
Languages
Python
90.5%
JavaScript
7.9%
Dockerfile
1.4%
CSS
0.2%
